
Visually represented data is the most appealing form of Data and Google Docs has amazing features to produce charts and graphs in your document!
But How to make a graph on Google Docs? Today we are going to address this question.
Google Docs is a platform used and adopted by many professional workers that need to formulate formal documents especially with visual representations. These documents are often presented as high pitches to companies or to professors, sometimes even CEOs. There are proper formats and requirements of these documents that Google Docs fulfills. These documents often involve the use of charts and graphs to visually represent and back up the data presented in textual form.
In this article, we will discuss the entire process of How to Make a Graph on Google Docs such that fit the document’s format and fulfill its factual purpose!
Microsoft Word and Microsoft Excel were the go-to applications for people for constructing such documents but recently, people have moved towards using the Google platforms. They now mainly use Google Docs and Google Sheets in replace of these platforms, respectively. This is because, aside from all the similar features that Microsoft Office provides, Google lets you share the document constantly with other users with permission for all users to make the necessary changes simultaneously. This way, there is no need for constant resending of the document after every change made.
With that being said, let’s begin the guide on how to make a graph on Google Docs.
Contents
How to Make a Graph on Google Docs?
One of the easiest methods of how to make a graph in Google Docs is by simply going to the Insert menu in the menu bar. From the drop-down menu, go to Chart.
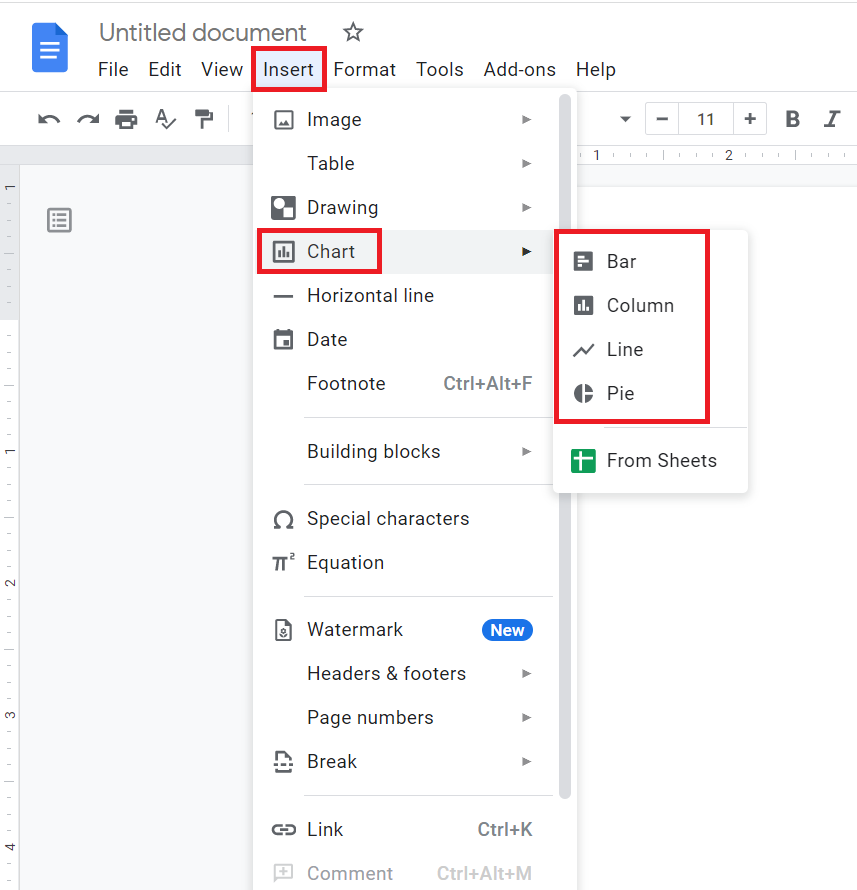
A list of different types of graphs will be made available to you. This will include a bar, column, line, and pie chart. According to the requirements of the data present in your Google Docs document, you can decide which graph type to go for.
However, the drawback of using that chart is that it’s static. Once you put in the values, you cannot edit or change them. You will have to redo the entire thing in case of a mistake.
How to Make a Graph on Google Docs Using Google Sheets?
Due to the drawback of using the charts available in Google Docs mentioned above, users are advised to make use of Google Sheets. Google Sheets offers a wider range of charts; once created, the chart is easier to format and edit. Google Sheets offers you a comfortable addition of dynamic data and lets you choose the data you actually want to add to your cart.
You would first need to make all the charts required in Google Sheets. For that, you would need to organize your data and adjust it in a chart best suited to your needs. Once the final product is ready, you can add it to your Google Docs document.
Here is the complete step-by-step process of how to make a graph on Google Docs using Google Sheets:
- Open your document in Google Docs.
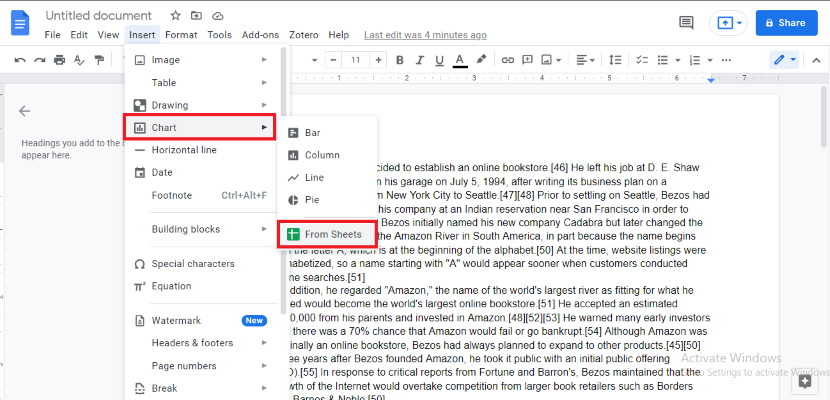
- Go to the Insert menu in the menu bar.
- From the drop-down menu select Chart.
- From the side menu, go to the option of From Sheets.
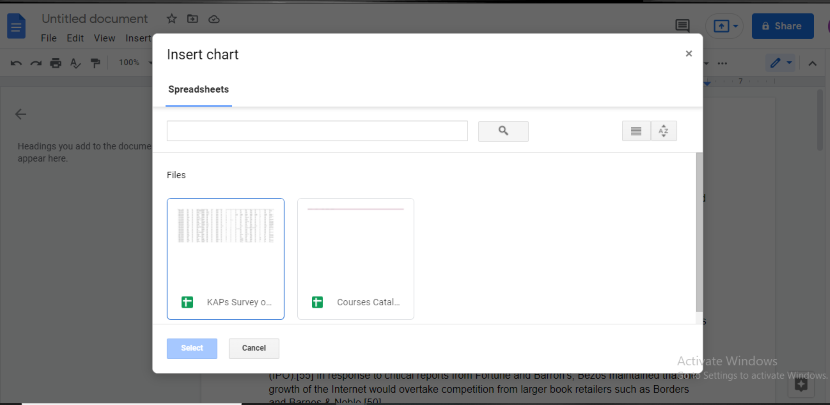
- By doing so, all your spreadsheets will be presented to you in a list.
- You can select the one that you have to add to your document.
- Click on the required Google Sheet.
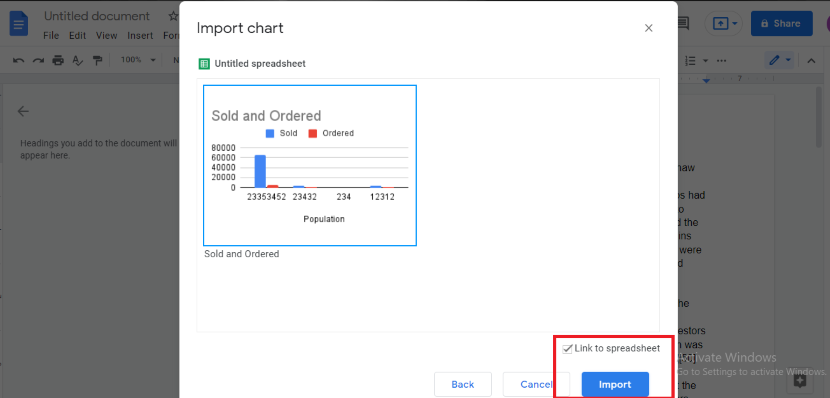
- You can also link that spreadsheet to your document if you want simultaneous data edit. The process to do that will be discussed ahead.
How to Make a New Spreadsheet Linked to Google Docs?
In case you do not have a spreadsheet made, you can construct one linked to your Google Docs. Here is how you can link your spreadsheet:
- Open your document in Google Docs.
- Go to the File from the menu bar.
- From the drop-down menu, select New and then go to Spreadsheet.
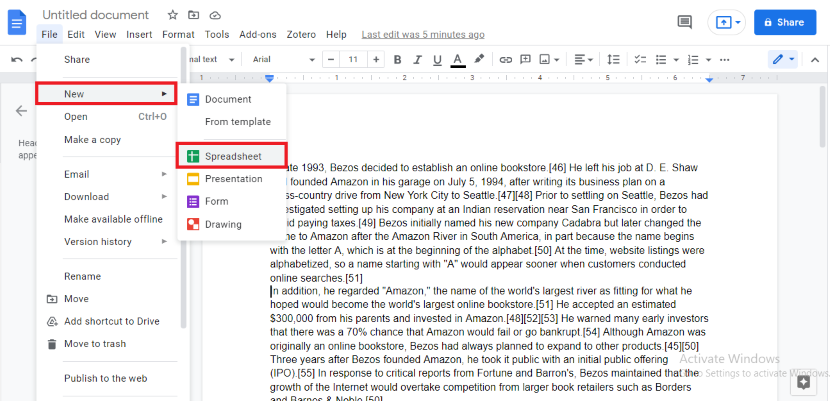
- This will open a new Google Sheet file.
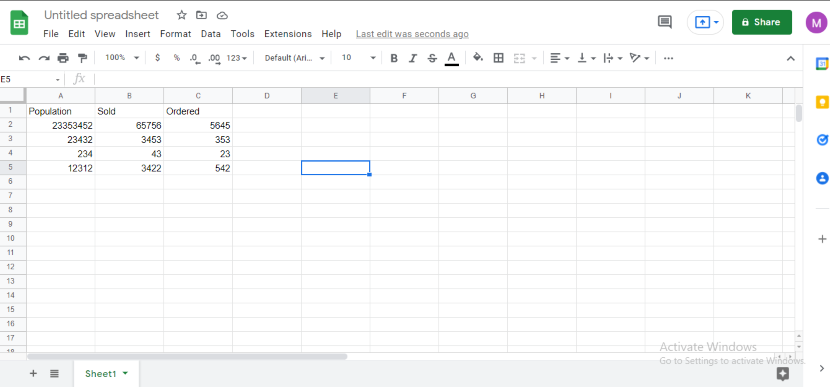
- In the new file, you can enter all your data in the cells that need to be converted into a chart.
- Once the data entry and organization are done, you can move toward formulating a chart.
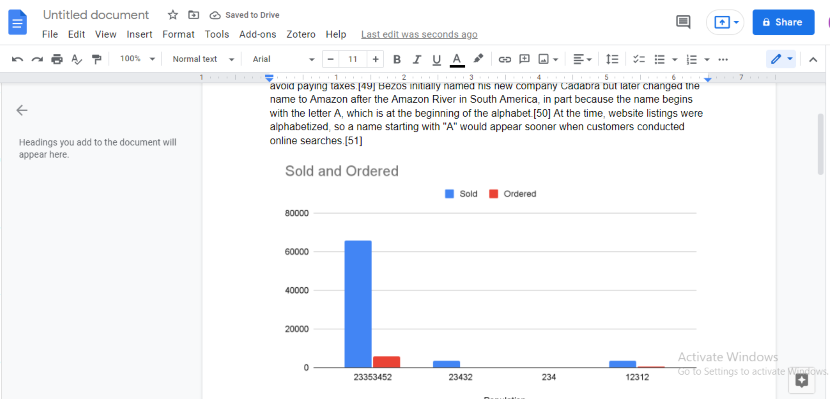
- As an example, we have entered the data of a product that has either already been sold to or has been ordered by different populations.
- Go to the Insert menu in the menu bar of this current Google Sheet.
- Select Chart from the drop-down menu.
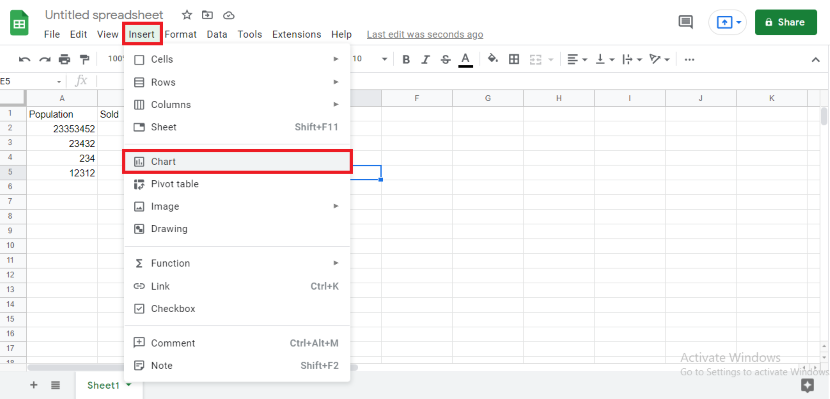
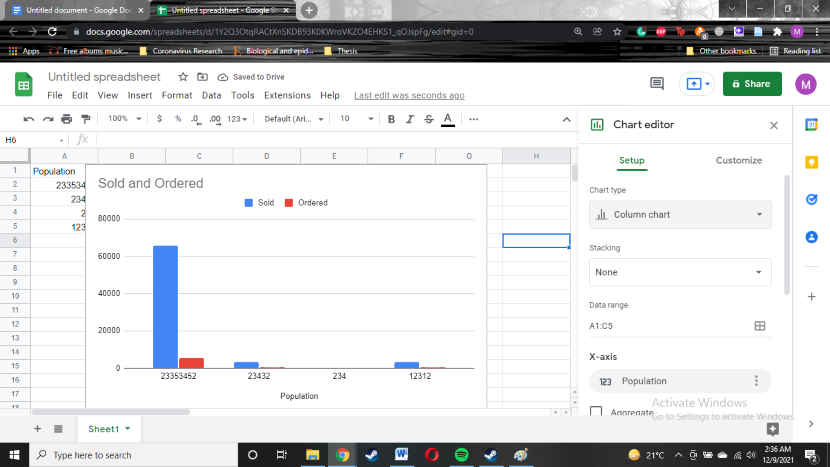
- From the side menu, you can select what sort of chart style you want.
- The formatting and editing of these different types of graphs can be quite complicated for a beginner. Check out our article here to learn more about how to make a graph in Google Sheets.
- Once you have successfully added the chart in Google Sheets, you can now import it to your Google Docs document.
- To import this chart, you have to go to the Insert menu in Google Docs.
- Go to Charts and select From Sheets.
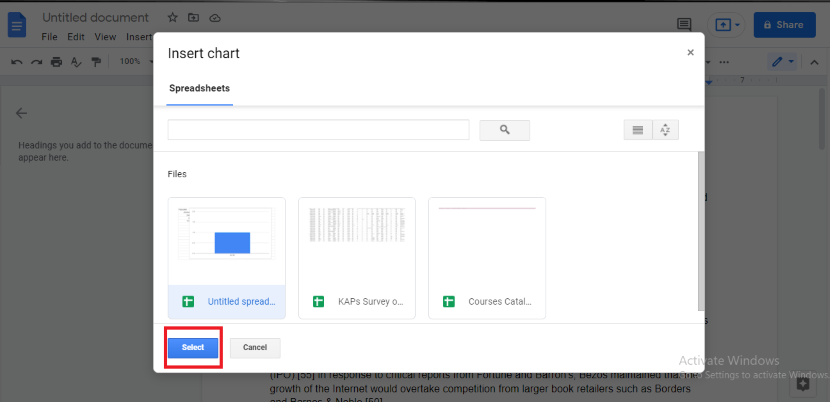
- This will open up a pop-up box with a series of different Google Sheets.
- You will then select the Google Sheet graph that you had just been working on.
- Now, click on Select.
- From the new window, click on the blue Import button.
- And just like that, you have successfully learned how to make a graph on Google Docs using Google Sheets as a medium.
Copying Graphs from Google Sheets
There is yet another way of how to make a graph on Google Docs using Google Sheets. If you have a chart made in Google Sheets and is ready to be added to your file, you can easily copy-paste it into your Google Docs document.
- For copying the chart, you can use the keyboard shortcut keys of CTRL+C for Windows and Command+C for Mac.
- For pasting use CTRL+V in Windows and Command+V for Mac.
Once you paste the chart, a pop-up message will then appear if you would like to link your spreadsheet to your Google Docs document. You can now dynamically add data and make changes to your chart in Google Sheets and the changes will be observed automatically in your Google Docs.
How convenient is that!
How to Make Edits in a Graph on Google Docs?
Since the charts offered by Google Docs itself are all static and you have to use Google Sheets, you have to make the necessary changes there (Google Sheets charts) as well. As mentioned above that once you link your spreadsheet to Google Docs, all the edits made in your data or spreadsheet in Google Sheets will automatically be observed in your Google Docs document.
Following is a step-wise guide on how you can edit graphs in Google Sheets, thereby making simultaneous changes to the graphs of Google Sheets:
- Open up your Google Docs document.
- Go to the Insert menu from the menu bar.
- From the drop-down menu, go to Chart.
- Click on the Google Sheet chart you wish to incorporate into your Google Docs document.
- On the top right corner would be a link icon. Choose Open Source from the options available.
- This will take you to the spreadsheet in Google Sheets where the chart is constructed.
- Double-click on the chart and click on Chart Editor. This will lead you to two tabs; Setup and Customize.
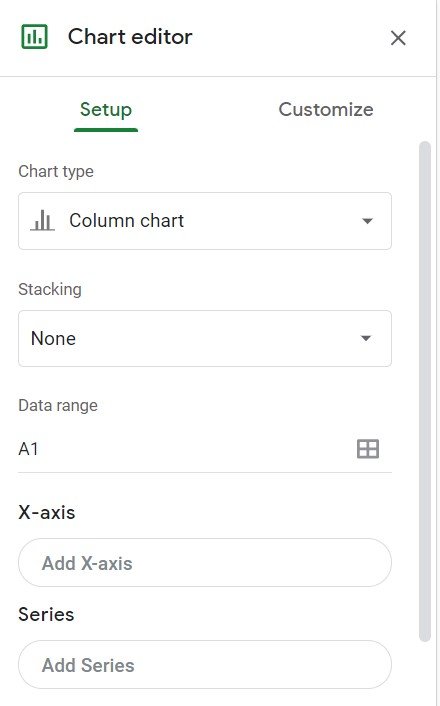
- If you click on Setup and then access the option of Chart type, it will show a number of different kinds of charts that you can choose from. You can change the type according to your document format and style.
- The heading of Customize will allow you to play will the appearance of the graph. You can change colors, alter fonts, and much more!
- If your graph was linked to your Google Docs document, you will have to click on the Update box.
- This will update the graph in your Google Docs document.
How to Edit the Graph’s Legend on Google Docs?
To access a graph’s legend, you have to go to the chart editor in the Google Sheet spreadsheet where the chart is constructed.
- Double click on the chart in your Google Sheet spreadsheet.
- Go to Chart Editor and select Customize.
- This will lead you to a list of customizable chart aspects.
- From this list, select Legend.

- Once you open the Legend settings, you will see a few options.
- These options include:
- Position: Auto/ To a particular side/ Inside
- Legend font, Legend font size, Legend format, Text color
- You can now edit the legend according to your preference.
How to Make a Graph on Google Docs when Using a Mobile?
Unfortunately, the mobile version of the Google Docs application does not offer charts for your document. However, you can follow the same concept for your PC in order to add charts. This means the incorporation of Google Sheets as a medium to get the task done. You can either construct a new chart in the Google Sheets spreadsheet or use a pre-existing one. You will need to install both Google Sheets and Google Docs on your mobile for this.
Here is a step-by-step guide on how to make a graph on Google Docs when using a mobile:
- Open the Google Sheets application on your mobile.
- You can now select a pre-existing spreadsheet or form a new one by tapping the + icon.
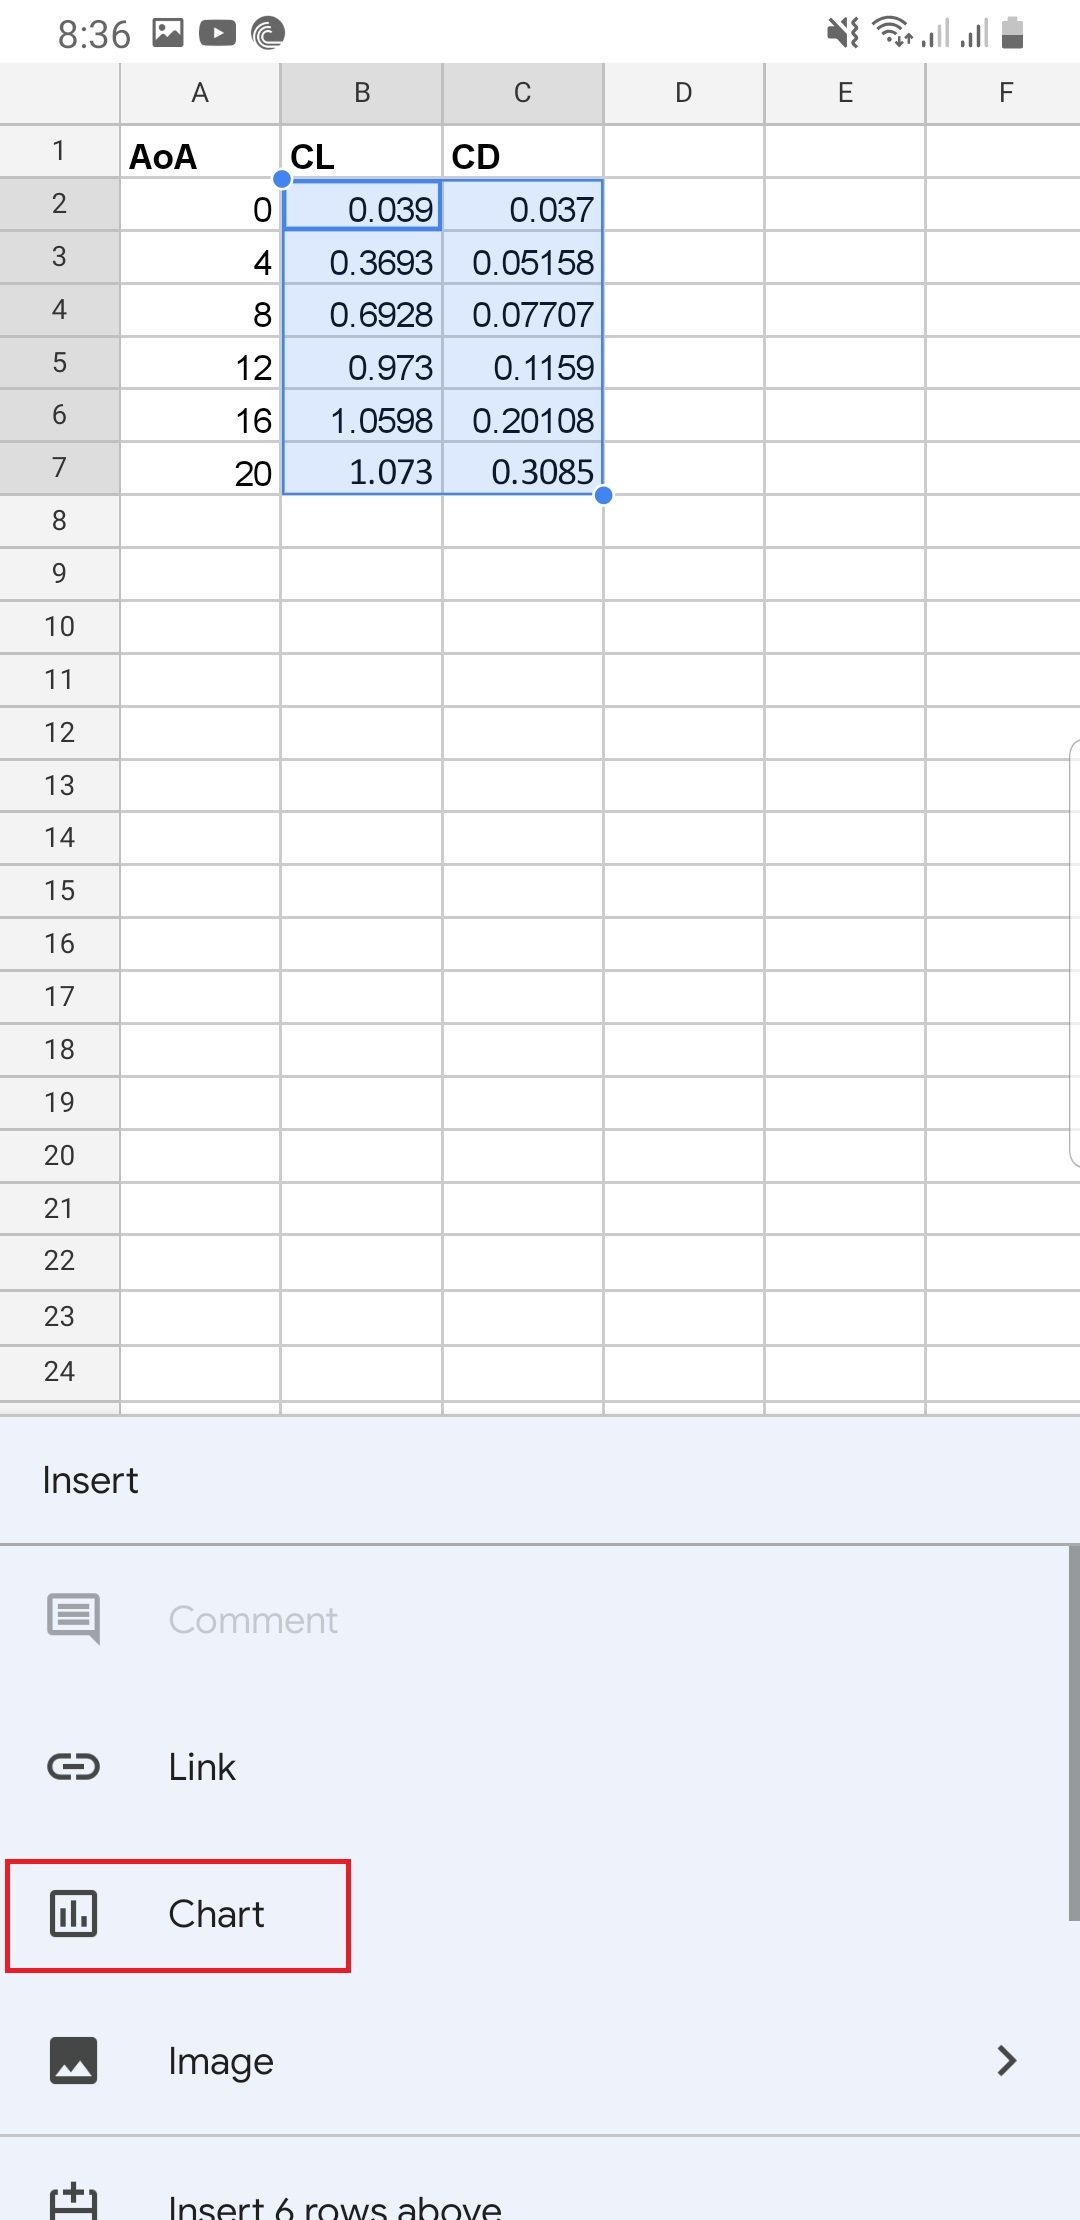
- Now, you add the Google Sheet data you want to construct a chart of and select it by dragging it.
- On top of the menu of the app, tap the + icon.
- From the menu opened, select Chart and change the parameters of the graph according to your needs.
How to Import a Graph from Google Sheets?
As already mentioned above, the best and most convenient method on how to make a graph on Google Docs is through importing the graph from Google Sheets directly. This can be done by accessing the desktop mode on your mobile. Once that is done, you can open your Google Docs document and go to the Insert menu. From here, select Chart. From the side menu, select From Sheets. This will let you import the spreadsheet where your graph has been constructed.
How to Make a Graph on Google Docs when Using a Mobile?
To make a graph on Google Docs when using a mobile device, you will have to follow the same method of first creating a graph on Google Sheets and importing it to Google Docs. Here is how you can make a graph on Google Docs using a mobile:
- Open your Google Sheets spreadsheet.
- Enter all the numerical data by means of which you will be creating the graph.
- Drag your finger across the data you wish to incorporate into your graph.
- Click on the Insert (+) icon on the top bar.
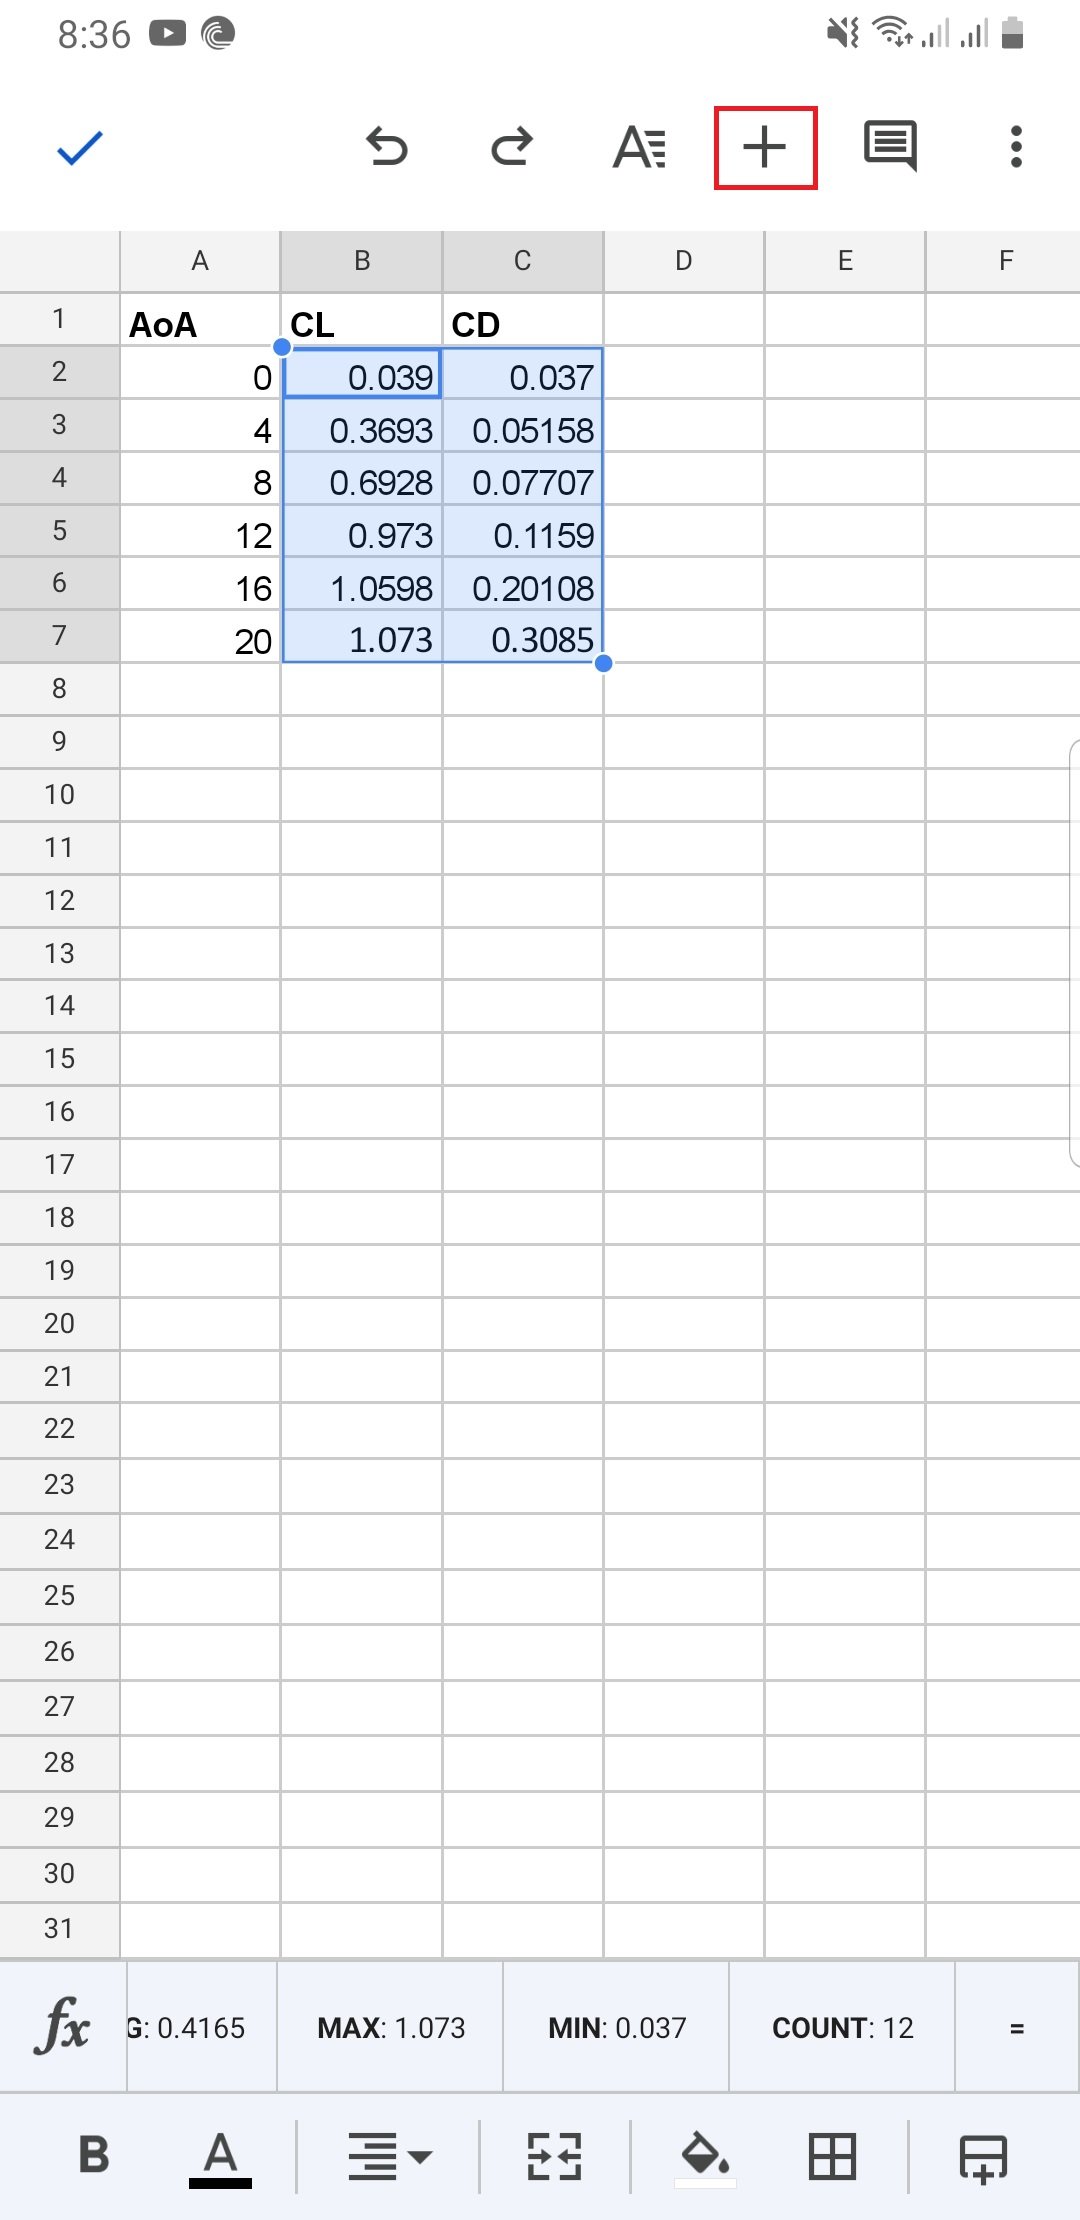
- From the list of options now made available to you, click on Chart to select a type of graph.
- This will open up yet another window that will display all of the options you will need to create a graph (e.g., pie charts, line graphs, bar graphs, etc.).
- You can make all the necessary edits using these options.
- Once you are done creating a graph according to your requirements, click on the tick mark on the top left of the screen.
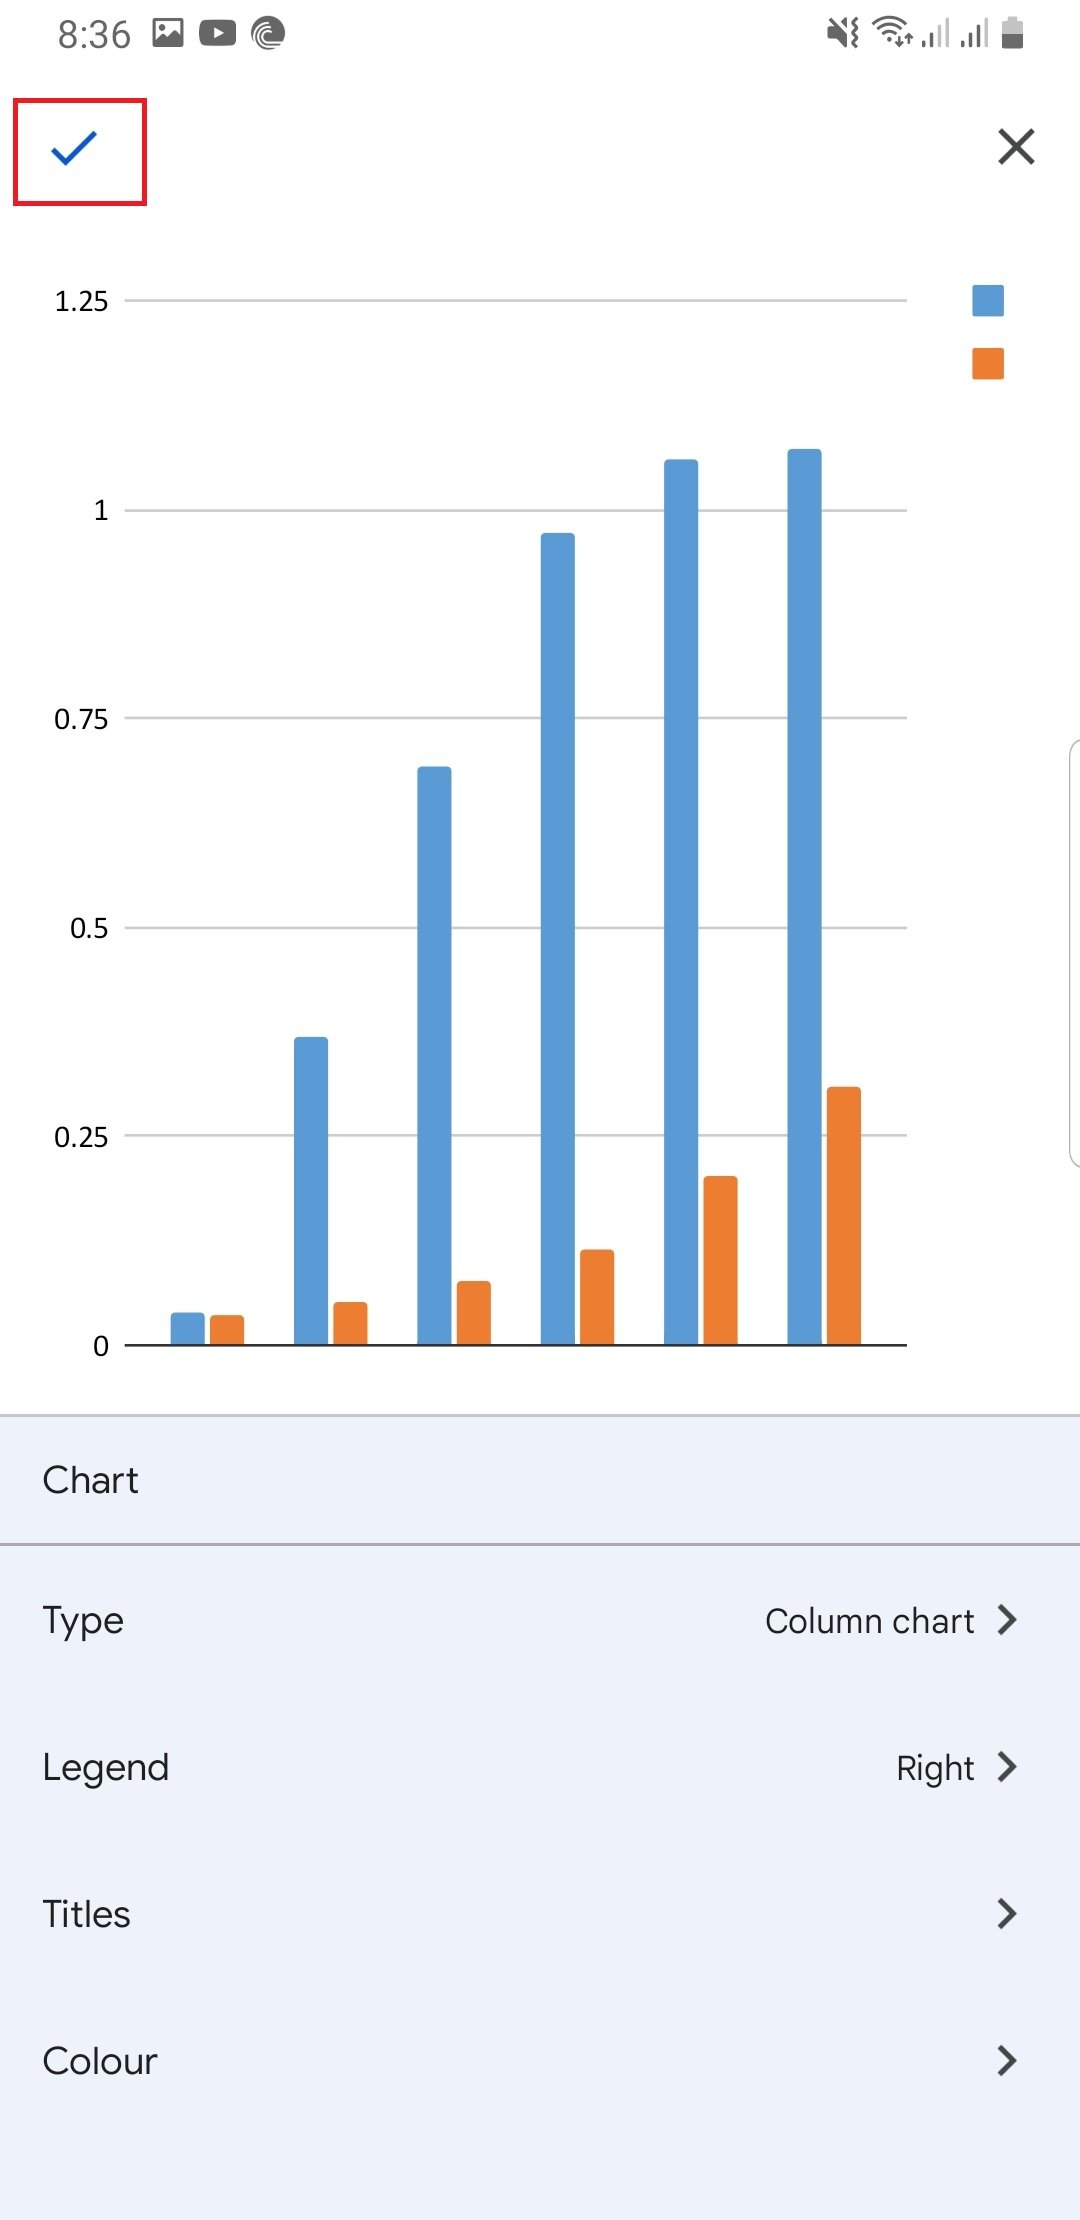
- Your graph will now appear on the main Google Sheets screen.
Read further: Learn how Add column in Google Docs
Learn how to make a text box in Google Docs